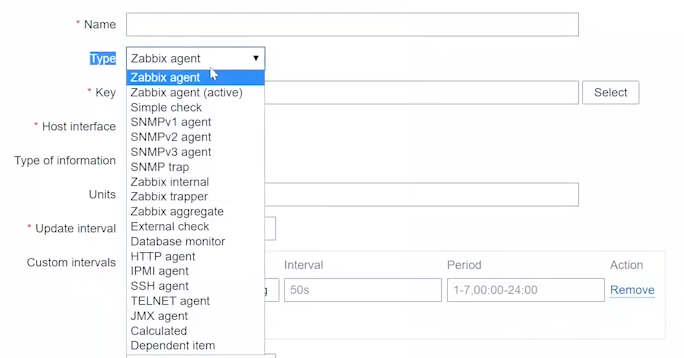
 When it comes to Zabbix agent modes, there is a choice between the active and the passive modes. Each time new items or hosts are added in the front end, you need to choose the item type.

This is mandatory as the item type determines how the item will work and collect data. For the Zabbix agent, there is a choice between ‘Zabbix agent (passive)’ and ‘Zabbix agent (active)’.
Active vs. Passive
You may already know the difference between the modes, but do you know the actual benefits that come with either option?
The main difference lies in the direction of the connection.

Active vs Passive agent connection
If you use the Zabbix agent in the passive mode, it means that the poller (internal server process) connects to the agent on port 10050/TCP and polls for a certain value (e.g., host CPU load). The poller waits until the agent on the host responds with the value. Then the server gets the value back, and the connection closes.
In the active mode, all data processing is performed on the agent, without the interference of pollers. However, the agent must know what metrics should be monitored, and that is why the agent connects to the trapper port 10051/TCP of the server once every two minutes (by default). The agent requests the information about the items, and then performs the monitoring on the host and pushes the data to the server via the same TCP port.
Topology benefits
The first benefit comes from the topology of the network the Zabbix agent is installed on. For instance, it might be that your customer doesn’t want any incoming connections in their environment, even from the internal network, but allows outbound connections. In this case, you will have to use active checks.
Now, imagine that you intend to set up automatic issue resolution on your hosts in addition to monitoring. The simplest example with Windows services would be configuring the items and triggers to check the health of specific services. But before notifying users about a Windows service that has stopped, you want to try to restart it automatically.
This is possible with remote commands. In the front end, open Configuration > Actions > Steps > Remote Command. Then enter the following CMD command:
|
1 |
net start |
Each time the trigger fires, the Zabbix agent will try to start the service. If it fails to do so, then a notification will be sent. But this remote command will only work with the Zabbix agent in the passive mode.
Performance benefits
Consider the active agent mode. As I already mentioned, the poller connects to the host, requests the data, and then waits until it receives the data or until the timeout is reached.

Server timeout value
The timeout value is stored in the Timeout variable in zabbix_server.conf. The maximum value is 30 seconds, which is too high to ever be used in production without proper reasons.

The timeout value can also be set in the Zabbix agent configuration file, zabbix_agentd.conf. If the timeout is set to three seconds, the poller will wait for three seconds or until the requested value is received.
How long does it usually take to receive a value? Find out by running the following command:
|
1 |
time zabbix_get -s 127.0.0.1 -k system.cpu.load |

It only takes 0.002 seconds.
Now, imagine that you have a custom parameter executing a Bash script that runs for 15 seconds every minute. Then the poller will wait for 15 seconds until it gets the value, which means that it won’t be able to process any other items in the meantime. The poller downtime will increase dramatically, and you will have to increase the number of these processes to keep up with the number of items.
The same applies to the agent. If you have an agent with a lot of scripts and user parameters, and those are relatively slow, then it will take time for the agent to process them. The number of the default internal agent processes is stored in the StartAgents variable.

There are three internal processes that can perform the required checks, which means that, by default, the agent can process three items simultaneously. This parameter can be increased if you have a lot of slow-running checks, and the agent acts as the bottleneck. By increasing the StartAgents value to 100 you will increase the number of pollers on the Zabbix server. It should be noted that having slow-running checks degrades the performance of your Zabbix server, but sometimes there are no other options.
It might seem that the active mode would be a better fit in this scenario — the server doesn’t interfere at all, and only receives the already collected data, while the processing is done on the agent. It forks the Bash script, waits for 15 seconds, and gets the data. Once the data is collected, the agent immediately sends a response to the server, so the server never has to wait while the script is running.

The downside is that there can only be one such process per each agent in the active mode, and it is impossible to increase the number of the checks. If you have multiple items running for 15 seconds each, with a short update interval on the host, and you configure all of those items as active checks, there will be a queue of pending checks.
The only way to avoid this is to configure those items as passive checks, and then you can increase the number of internal processes handling these checks by changing the StartAgents variable in zabbix_agentd.conf. Note that you have to restart the binary process after changing the config file.
To sum it up, in most cases with quick checks, having an active agent is better in terms of performance. The drawback is that you cannot use remote commands.
Conversely, if you have a lot of slow items taking 30 seconds each, and you cannot process them outside of the agent, then passive checks are your only option. Using those, you can increase the number of processes on the agent side.
The additional benefit of the active checks is that the agent has a memory buffer for those checks. This means that you won’t lose the data in case of a network issue. Using passive checks means that you cannot use the buffer.
Agent configuration
Now, onto the most important part, namely configuring the agent in the active or the passive modes. The default setting is passive, meaning that even the default Zabbix server host has all of the Zabbix agent item types configured as passive.
It should be noted that each agent can run in two modes simultaneously. You could have one machine with ten items running in the passive mode, and ten items running in the active mode. This is done using the same agent installation, the difference being in the configuration file.
Passive checks

When configuring passive checks in zabbix_agentd.conf, you only need to change one parameter Server. It is a comma-separated list of IP addresses and DNS names from which the agent will accept incoming connections. The Zabbix server connects to this agent and polls the data.
Active checks

Active checks require a more in-depth configuration. First of all, you need the ServerActive variable. This is the list of IP addresses and DNS names of your Zabbix servers or proxies to which the agent will connect once every two minutes to request the configuration. After it receives the configuration, it starts the requested monitoring and pushes the collected data.

In the same zabbix_agentd.conf file, there is also a parameter called Hostname. This hostname must match the hostname specified in the front end (case sensitive).

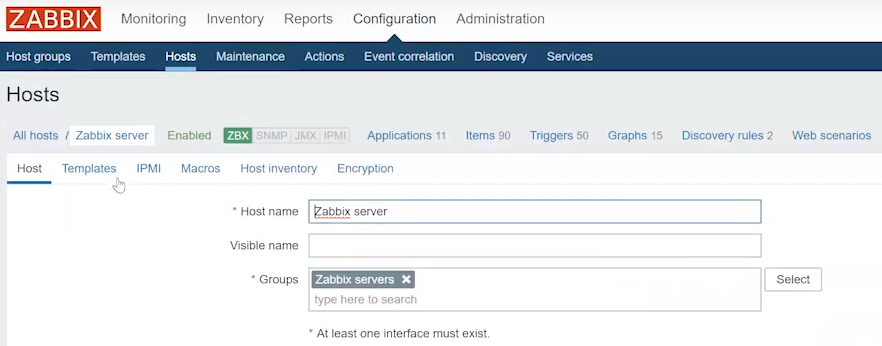
Hostname in the front end
To view the hostname in the front end, go to Configuration > Hosts. Note that this value is case sensitive.

Further down in zabbix_agentd.conf, there is also the HostnameItem parameter. If the hostname is not set, then the item specified here is executed on the host, and the returned value of that item is taken as the hostname. The default value is ‘system.hostname’.
When the HostnameItem parameter is not set, the actual system hostname is used. However, the latter doesn’t always match the intended value. You can check the default reported hostname by running the following Bash command:
|
1 |
zabbix_get -s 127.0.0.1 -k system.hostname |
Imagine you have a Zabbix server and an agent with a hostname ‘Zabbix server’, and there is also a different server running a Zabbix agent with the same hostname. The items from your Zabbix server host will then receive their values from two different servers.
This means that you will start seeing discrepancies in reported values. For instance, free disk space can be changing repeatedly between two different values, each one valid for its respective server, resulting in erroneous reporting. This underpins the importance of assigning unique hostnames to each agent.


