 There are two ways to invoke sar.
- sar followed by an option (without specifying a saXX data file). This will look for the current day’s saXX data file and report the performance data that was recorded until that point for the current day.
- sar followed by an option, and additionally specifying a saXX data file using -f option. This will report the performance data for that particular day. i.e XX is the day of the month.
In all the examples below, we are going to explain how to view certain performance data for the current day. To look for a specific day, add “-f /var/log/sa/saXX” at the end of the sar command.
All the sar command will have the following as the 1st line in its output.
|
1 2 |
$ sar -u Linux 2.6.18-194.el5PAE (dev-db) 03/26/2011 _i686_ (8 CPU) |
- Linux 2.6.18-194.el5PAE – Linux kernel version of the system.
- (dev-db) – The hostname where the sar data was collected.
- 03/26/2011 – The date when the sar data was collected.
- _i686_ – The system architecture
- (8 CPU) – Number of CPUs available on this system. On multi core systems, this indicates the total number of cores.
1. CPU Usage of ALL CPUs (sar -u)
This gives the cumulative real-time CPU usage of all CPUs. “1 3” reports for every 1 seconds a total of 3 times. Most likely you’ll focus on the last field “%idle” to see the cpu load.
|
1 2 3 4 5 6 7 8 |
$ sar -u 1 3 Linux 2.6.18-194.el5PAE (dev-db) 03/26/2011 _i686_ (8 CPU) 01:27:32 PM CPU %user %nice %system %iowait %steal %idle 01:27:33 PM all 0.00 0.00 0.00 0.00 0.00 100.00 01:27:34 PM all 0.25 0.00 0.25 0.00 0.00 99.50 01:27:35 PM all 0.75 0.00 0.25 0.00 0.00 99.00 Average: all 0.33 0.00 0.17 0.00 0.00 99.50 |
Following are few variations:
- sar -u Displays CPU usage for the current day that was collected until that point.
- sar -u 1 3 Displays real time CPU usage every 1 second for 3 times.
- sar -u ALL Same as “sar -u” but displays additional fields.
- sar -u ALL 1 3 Same as “sar -u 1 3” but displays additional fields.
- sar -u -f /var/log/sa/sa10 Displays CPU usage for the 10day of the month from the sa10 file.
2. CPU Usage of Individual CPU or Core (sar -P)
If you have 4 Cores on the machine and would like to see what the individual cores are doing, do the following.
“-P ALL” indicates that it should displays statistics for ALL the individual Cores.
In the following example under “CPU” column 0, 1, 2, and 3 indicates the corresponding CPU core numbers.
|
1 2 3 4 5 6 7 8 9 |
$ sar -P ALL 1 1 Linux 2.6.18-194.el5PAE (dev-db) 03/26/2011 _i686_ (8 CPU) 01:34:12 PM CPU %user %nice %system %iowait %steal %idle 01:34:13 PM all 11.69 0.00 4.71 0.69 0.00 82.90 01:34:13 PM 0 35.00 0.00 6.00 0.00 0.00 59.00 01:34:13 PM 1 22.00 0.00 5.00 0.00 0.00 73.00 01:34:13 PM 2 3.00 0.00 1.00 0.00 0.00 96.00 01:34:13 PM 3 0.00 0.00 0.00 0.00 0.00 100.00 |
“-P 1” indicates that it should displays statistics only for the 2nd Core. (Note that Core number starts from 0).
|
1 2 3 4 5 |
$ sar -P 1 1 1 Linux 2.6.18-194.el5PAE (dev-db) 03/26/2011 _i686_ (8 CPU) 01:36:25 PM CPU %user %nice %system %iowait %steal %idle 01:36:26 PM 1 8.08 0.00 2.02 1.01 0.00 88.89 |
Following are few variations:
- sar -P ALL Displays CPU usage broken down by all cores for the current day.
- sar -P ALL 1 3 Displays real time CPU usage for ALL cores every 1 second for 3 times (broken down by all cores).
- sar -P 1 Displays CPU usage for core number 1 for the current day.
- sar -P 1 1 3 Displays real time CPU usage for core number 1, every 1 second for 3 times.
- sar -P ALL -f /var/log/sa/sa10 Displays CPU usage broken down by all cores for the 10day day of the month from sa10 file.
3. Memory Free and Used (sar -r)
This reports the memory statistics. “1 3” reports for every 1 seconds a total of 3 times. Most likely you’ll focus on “kbmemfree” and “kbmemused” for free and used memory.
|
1 2 3 4 5 6 7 8 |
$ sar -r 1 3 Linux 2.6.18-194.el5PAE (dev-db) 03/26/2011 _i686_ (8 CPU) 07:28:06 AM kbmemfree kbmemused %memused kbbuffers kbcached kbcommit %commit kbactive kbinact 07:28:07 AM 6209248 2097432 25.25 189024 1796544 141372 0.85 1921060 88204 07:28:08 AM 6209248 2097432 25.25 189024 1796544 141372 0.85 1921060 88204 07:28:09 AM 6209248 2097432 25.25 189024 1796544 141372 0.85 1921060 88204 Average: 6209248 2097432 25.25 189024 1796544 141372 0.85 1921060 88204 |
Following are few variations:
- sar -r
- sar -r 1 3
- sar -r -f /var/log/sa/sa10
4. Swap Space Used (sar -S)
This reports the swap statistics. “1 3” reports for every 1 seconds a total of 3 times. If the “kbswpused” and “%swpused” are at 0, then your system is not swapping.
|
1 2 3 4 5 6 7 8 |
$ sar -S 1 3 Linux 2.6.18-194.el5PAE (dev-db) 03/26/2011 _i686_ (8 CPU) 07:31:06 AM kbswpfree kbswpused %swpused kbswpcad %swpcad 07:31:07 AM 8385920 0 0.00 0 0.00 07:31:08 AM 8385920 0 0.00 0 0.00 07:31:09 AM 8385920 0 0.00 0 0.00 Average: 8385920 0 0.00 0 0.00 |
Following are few variations:
- sar -S
- sar -S 1 3
- sar -S -f /var/log/sa/sa10
Notes:
- Use “sar -R” to identify number of memory pages freed, used, and cached per second by the system.
- Use “sar -H” to identify the hugepages (in KB) that are used and available.
- Use “sar -B” to generate paging statistics. i.e Number of KB paged in (and out) from disk per second.
- Use “sar -W” to generate page swap statistics. i.e Page swap in (and out) per second.
5. Overall I/O Activities (sar -b)
This reports I/O statistics. “1 3” reports for every 1 seconds a total of 3 times.
Following fields are displays in the example below.
- tps – Transactions per second (this includes both read and write)
- rtps – Read transactions per second
- wtps – Write transactions per second
- bread/s – Bytes read per second
- bwrtn/s – Bytes written per second
|
1 2 3 4 5 6 7 8 |
$ sar -b 1 3 Linux 2.6.18-194.el5PAE (dev-db) 03/26/2011 _i686_ (8 CPU) 01:56:28 PM tps rtps wtps bread/s bwrtn/s 01:56:29 PM 346.00 264.00 82.00 2208.00 768.00 01:56:30 PM 100.00 36.00 64.00 304.00 816.00 01:56:31 PM 282.83 32.32 250.51 258.59 2537.37 Average: 242.81 111.04 131.77 925.75 1369.90 |
Following are few variations:
- sar -b
- sar -b 1 3
- sar -b -f /var/log/sa/sa10
Note: Use “sar -v” to display number of inode handlers, file handlers, and pseudo-terminals used by the system.
6. Individual Block Device I/O Activities (sar -d)
To identify the activities by the individual block devices (i.e a specific mount point, or LUN, or partition), use “sar -d”
|
1 2 3 4 5 6 7 8 9 10 11 12 |
$ sar -d 1 1 Linux 2.6.18-194.el5PAE (dev-db) 03/26/2011 _i686_ (8 CPU) 01:59:45 PM DEV tps rd_sec/s wr_sec/s avgrq-sz avgqu-sz await svctm %util 01:59:46 PM dev8-0 1.01 0.00 0.00 0.00 0.00 4.00 1.00 0.10 01:59:46 PM dev8-1 1.01 0.00 0.00 0.00 0.00 4.00 1.00 0.10 01:59:46 PM dev120-64 3.03 64.65 0.00 21.33 0.03 9.33 5.33 1.62 01:59:46 PM dev120-65 3.03 64.65 0.00 21.33 0.03 9.33 5.33 1.62 01:59:46 PM dev120-0 8.08 0.00 105.05 13.00 0.00 0.38 0.38 0.30 01:59:46 PM dev120-1 8.08 0.00 105.05 13.00 0.00 0.38 0.38 0.30 01:59:46 PM dev120-96 1.01 8.08 0.00 8.00 0.01 9.00 9.00 0.91 01:59:46 PM dev120-97 1.01 8.08 0.00 8.00 0.01 9.00 9.00 0.91 |
In the above example “DEV” indicates the specific block device.
For example: “dev53-1” means a block device with 53 as major number, and 1 as minor number.
The device name (DEV column) can display the actual device name (for example: sda, sda1, sdb1 etc.,), if you use the -p option (pretty print) as shown below.
|
1 2 3 4 5 6 7 8 9 10 11 12 |
$ sar -p -d 1 1 Linux 2.6.18-194.el5PAE (dev-db) 03/26/2011 _i686_ (8 CPU) 01:59:45 PM DEV tps rd_sec/s wr_sec/s avgrq-sz avgqu-sz await svctm %util 01:59:46 PM sda 1.01 0.00 0.00 0.00 0.00 4.00 1.00 0.10 01:59:46 PM sda1 1.01 0.00 0.00 0.00 0.00 4.00 1.00 0.10 01:59:46 PM sdb1 3.03 64.65 0.00 21.33 0.03 9.33 5.33 1.62 01:59:46 PM sdc1 3.03 64.65 0.00 21.33 0.03 9.33 5.33 1.62 01:59:46 PM sde1 8.08 0.00 105.05 13.00 0.00 0.38 0.38 0.30 01:59:46 PM sdf1 8.08 0.00 105.05 13.00 0.00 0.38 0.38 0.30 01:59:46 PM sda2 1.01 8.08 0.00 8.00 0.01 9.00 9.00 0.91 01:59:46 PM sdb2 1.01 8.08 0.00 8.00 0.01 9.00 9.00 0.91 |
Following are few variations:
- sar -d
- sar -d 1 3
- sar -d -f /var/log/sa/sa10
- sar -p -d
7. Display context switch per second (sar -w)
This reports the total number of processes created per second, and total number of context switches per second. “1 3” reports for every 1 seconds a total of 3 times.
|
1 2 3 4 5 6 7 |
$ sar -w 1 3 Linux 2.6.18-194.el5PAE (dev-db) 03/26/2011 _i686_ (8 CPU) 08:32:24 AM proc/s cswch/s 08:32:25 AM 3.00 53.00 08:32:26 AM 4.00 61.39 08:32:27 AM 2.00 57.00 |
Following are few variations:
- sar -w
- sar -w 1 3
- sar -w -f /var/log/sa/sa10
8. Reports run queue and load average (sar -q)
This reports the run queue size and load average of last 1 minute, 5 minutes, and 15 minutes. “1 3” reports for every 1 seconds a total of 3 times.
|
1 2 3 4 5 6 7 8 |
$ sar -q 1 3 Linux 2.6.18-194.el5PAE (dev-db) 03/26/2011 _i686_ (8 CPU) 06:28:53 AM runq-sz plist-sz ldavg-1 ldavg-5 ldavg-15 blocked 06:28:54 AM 0 230 2.00 3.00 5.00 0 06:28:55 AM 2 210 2.01 3.15 5.15 0 06:28:56 AM 2 230 2.12 3.12 5.12 0 Average: 3 230 3.12 3.12 5.12 0 |
Note: The “blocked” column displays the number of tasks that are currently blocked and waiting for I/O operation to complete.
Following are few variations:
- sar -q
- sar -q 1 3
- sar -q -f /var/log/sa/sa10
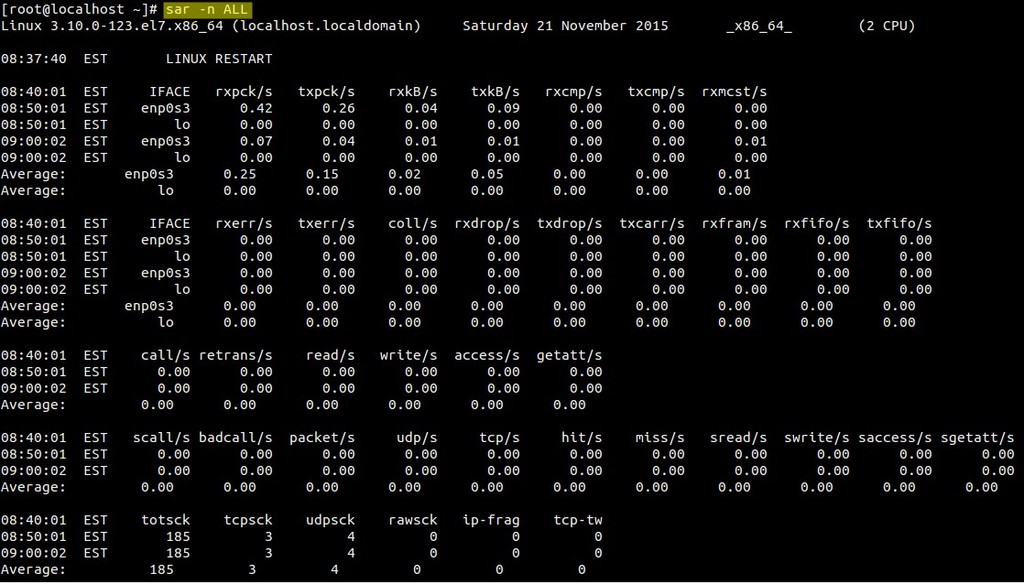
9. Report network statistics (sar -n)
This reports various network statistics. For example: number of packets received (transmitted) through the network card, statistics of packet failure etc.,. “1 3” reports for every 1 seconds a total of 3 times.
|
1 |
sar -n KEYWORD |
KEYWORD can be one of the following:
- DEV – Displays network devices vital statistics for eth0, eth1, etc.,
- EDEV – Display network device failure statistics
- NFS – Displays NFS client activities
- NFSD – Displays NFS server activities
- SOCK – Displays sockets in use for IPv4
- IP – Displays IPv4 network traffic
- EIP – Displays IPv4 network errors
- ICMP – Displays ICMPv4 network traffic
- EICMP – Displays ICMPv4 network errors
- TCP – Displays TCPv4 network traffic
- ETCP – Displays TCPv4 network errors
- UDP – Displays UDPv4 network traffic
- SOCK6, IP6, EIP6, ICMP6, UDP6 are for IPv6
- ALL – This displays all of the above information. The output will be very long.
|
1 2 3 4 5 6 7 |
$ sar -n DEV 1 1 Linux 2.6.18-194.el5PAE (dev-db) 03/26/2011 _i686_ (8 CPU) 01:11:13 PM IFACE rxpck/s txpck/s rxbyt/s txbyt/s rxcmp/s txcmp/s rxmcst/s 01:11:14 PM lo 0.00 0.00 0.00 0.00 0.00 0.00 0.00 01:11:14 PM eth0 342.57 342.57 93923.76 141773.27 0.00 0.00 0.00 01:11:14 PM eth1 0.00 0.00 0.00 0.00 0.00 0.00 0.00 |
10. Report Sar Data Using Start Time (sar -s)
When you view historic sar data from the /var/log/sa/saXX file using “sar -f” option, it displays all the sar data for that specific day starting from 12:00 a.m for that day.
Using “-s hh:mi:ss” option, you can specify the start time. For example, if you specify “sar -s 10:00:00”, it will display the sar data starting from 10 a.m (instead of starting from midnight) as shown below.
You can combine -s option with other sar option.
For example, to report the load average on 26th of this month starting from 10 a.m in the morning, combine the -q and -s option as shown below.
|
1 2 3 4 5 6 7 8 9 |
$ sar -q -f /var/log/sa/sa23 -s 10:00:01 Linux 2.6.18-194.el5PAE (dev-db) 03/26/2011 _i686_ (8 CPU) 10:00:01 AM runq-sz plist-sz ldavg-1 ldavg-5 ldavg-15 blocked 10:10:01 AM 0 127 2.00 3.00 5.00 0 10:20:01 AM 0 127 2.00 3.00 5.00 0 ... 11:20:01 AM 0 127 5.00 3.00 3.00 0 12:00:01 PM 0 127 4.00 2.00 1.00 0 |
There is no option to limit the end-time. You just have to get creative and use head command as shown below.
For example, starting from 10 a.m, if you want to see 7 entries, you have to pipe the above output to “head -n 10”.
|
1 2 3 4 5 6 7 8 9 10 11 |
$ sar -q -f /var/log/sa/sa23 -s 10:00:01 | head -n 10 Linux 2.6.18-194.el5PAE (dev-db) 03/26/2011 _i686_ (8 CPU) 10:00:01 AM runq-sz plist-sz ldavg-1 ldavg-5 ldavg-15 blocked 10:10:01 AM 0 127 2.00 3.00 5.00 0 10:20:01 AM 0 127 2.00 3.00 5.00 0 10:30:01 AM 0 127 3.00 5.00 2.00 0 10:40:01 AM 0 127 4.00 2.00 1.00 2 10:50:01 AM 0 127 3.00 5.00 5.00 0 11:00:01 AM 0 127 2.00 1.00 6.00 0 11:10:01 AM 0 127 1.00 3.00 7.00 2 |