SAR stands for System Activity Report, as its name suggest sar command is used to collect,report & save CPU, Memory, I/O usage in Unix like operating system. SAR command produce the reports on the fly and can also save the reports in the log files as well.
In this article we will discuss different examples of SAR Command in CentOS 7 & RHEL 7, in case sar is not installed on your system then use the below command to install it.
|
1 |
[root@localhost ~]# yum install sysstat |
Start the sadc (system activity data collector) service(sysstat) so that it saves the reports in log file “/var/log/sa/saDD” where DD represents Current day and already existing files will be archived.
|
1 2 |
[root@localhost ~]# systemctl start sysstat [root@localhost ~]# systemctl enable sysstat |
Sysstat package utilities:
- sar collects and displays ALL system activities statistics.
- sadc stands for “system activity data collector”. This is the sar backend tool that does the data collection.
- sa1 stores system activities in binary data file. sa1 depends on sadc for this purpose. sa1 runs from cron.
- sa2 creates daily summary of the collected statistics. sa2 runs from cron.
- sadf can generate sar report in CSV, XML, and various other formats. Use this to integrate sar data with other tools.
- iostat generates CPU, I/O statistics
- mpstat displays CPU statistics.
- pidstat reports statistics based on the process id (PID)
- nfsiostat displays NFS I/O statistics.
- cifsiostat generates CIFS statistics.
Collect the sar statistics using cron job – sa1 and sa2
Create sysstat file under /etc/cron.d directory that will collect the historical sar data.
It collects the data every 10 minutes and generate its report daily. Below crontab file is responsible for collecting and generating reports.
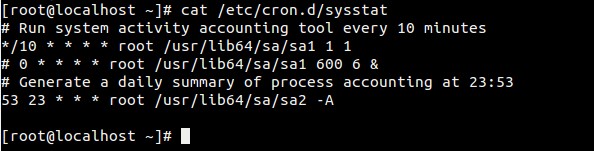
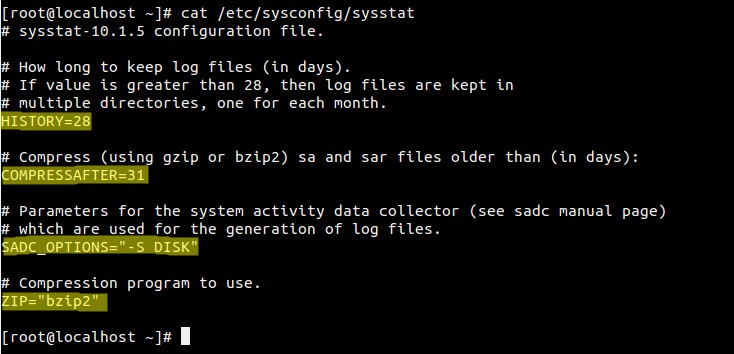
Below is the Config File of SysStat ( sar command ).
If you’ve installed sysstat from source, the default location of sa1 and sa2 is /usr/local/lib/sa. If you’ve installed using your distribution update method (for example: yum, up2date, or apt-get), this might be /usr/lib/sa/sa1 and /usr/lib/sa/sa2.
/usr/local/lib/sa/sa1
- This runs every 10 minutes and collects sar data for historical reference.
- If you want to collect sar statistics every 5 minutes, change */10 to */5 in the above /etc/cron.d/sysstat file.
- This writes the data to /var/log/sa/saXX file. XX is the day of the month. saXX file is a binary file. You cannot view its content by opening it in a text editor.
- For example, If today is 26th day of the month, sa1 writes the sar data to /var/log/sa/sa26
- You can pass two parameters to sa1: interval (in seconds) and count.
- In the above crontab example: sa1 1 1 means that sa1 collects sar data 1 time with 1 second interval (for every 10 mins).
/usr/local/lib/sa/sa2
- This runs close to midnight (at 23:53) to create the daily summary report of the sar data.
- sa2 creates /var/log/sa/sarXX file (Note that this is different than saXX file that is created by sa1). This sarXX file created by sa2 is an ascii file that you can view it in a text editor.
- This will also remove saXX files that are older than a week. So, write a quick shell script that runs every week to copy the /var/log/sa/* files to some other directory to do historical sar data analysis.
Example:1 Generating CPU Report on the Fly 5 times every 2 seconds.
|
1 2 3 4 5 6 7 8 9 10 11 |
[root@localhost ~]# sar 2 5 Linux 3.10.0-123.el7.x86_64 (localhost.localdomain) Monday 26 October 2015 _x86_64_ (2 CPU) 01:43:55 EDT CPU %user %nice %system %iowait %steal %idle 01:43:57 EDT all 0.00 0.00 0.25 0.00 0.00 99.75 01:43:59 EDT all 0.00 0.00 0.00 0.00 0.00 100.00 01:44:01 EDT all 0.00 0.00 0.25 0.00 0.00 99.75 01:44:03 EDT all 0.00 0.00 0.25 0.25 0.00 99.50 01:44:05 EDT all 0.00 0.00 0.00 0.00 0.00 100.00 Average: all 0.00 0.00 0.15 0.05 0.00 99.80 [root@localhost ~]# |
If the %I/O wait is more than zero for a longer period of time then we can consider there is some bottleneck in I/O system ( Hard disk or Network )
Example:2 Saving sar output to a file using -o
|
1 2 |
[root@localhost ~]# sar 2 5 -o /tmp/data > /dev/null 2>&1 [root@localhost ~]# |
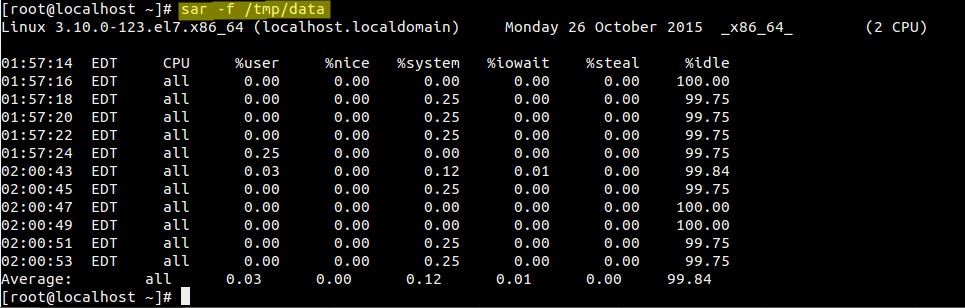
use “sar -f <file-name>” to display the reports.
|
1 |
[root@localhost ~]# sar -f /tmp/data |
Example:3 Generating Memory Usage report using -r
-r option in the sar command is used to generate memory usage report.
|
1 |
[root@localhost ~]# sar -r 2 5 |
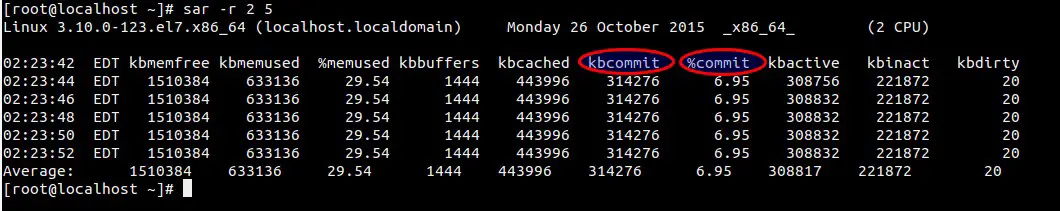
kbcommit & %commit is the overall memory used including RAM & Swap
Example:4 Generating Paging Statistics Report using -B
-B option in the sar command is used to display paging statistics.
|
1 |
[root@localhost ~]# sar -B 2 5 |
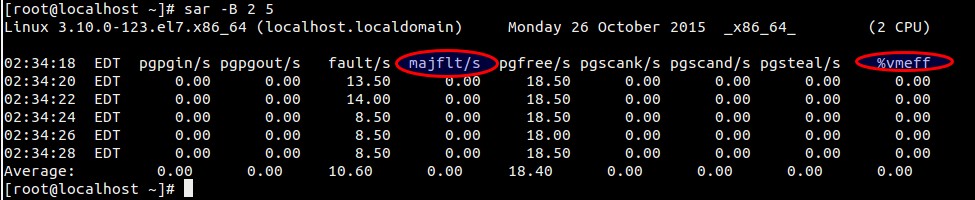
In the report majflts/s shows the major faults per second means number of pages loaded into the memory from disk (swap), if its value is higher then we can say that system is running of RAM.
%vmeff indicates the number of pages scanned per second, if it’s vaule is 100 % its is consider OK and when it is below 30 % then there is some issue with virtual memory. Zero value indicates that there is no page scanned during that time.
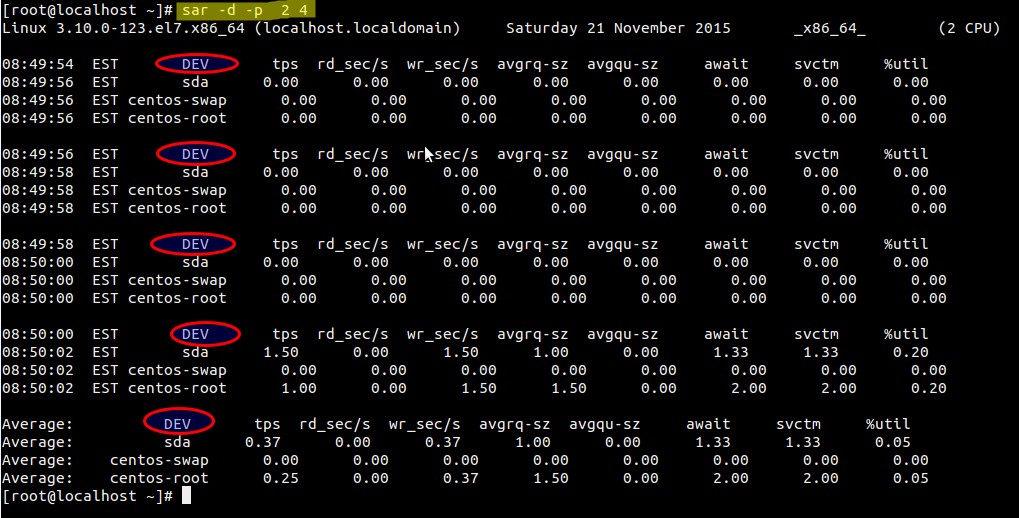
Example:5 Generating block device statistics report using -d
-d option in the sar command is used to display the block device statistics report. Using option -p (pretty-print) along with -d make the dev column more readable, example is shown below :
|
1 |
[root@localhost ~]# sar -d -p 2 4 |
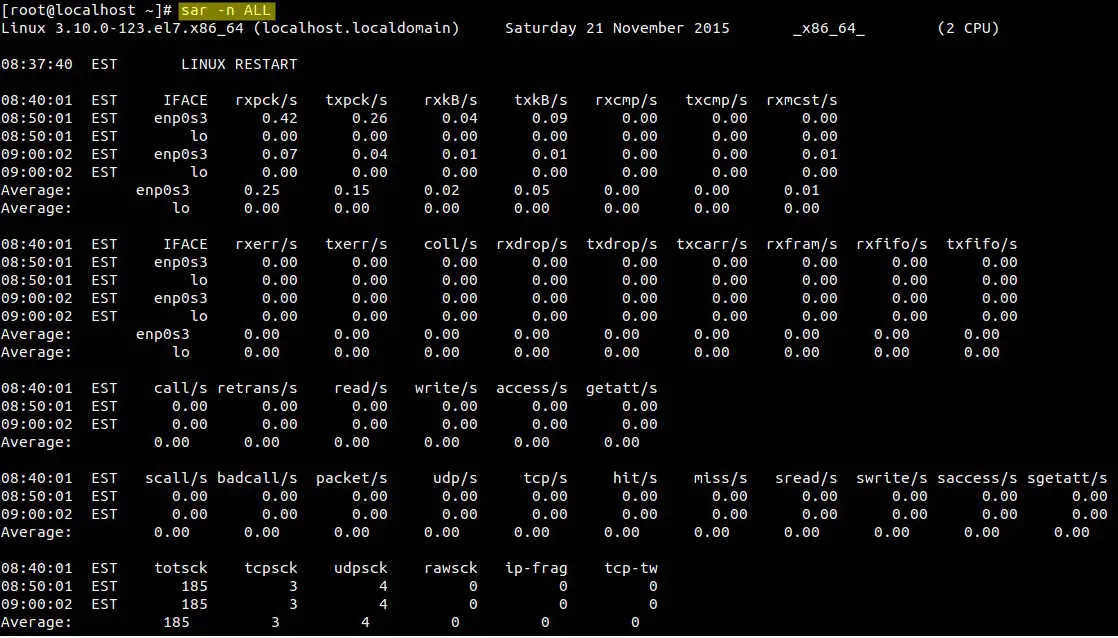
Example:6 Generating Network statistic report using -n
-n option in the sar command is used to generate network statistic report. Below is the synatx :
# sar -n {keyword} or {ALL}
Following keywords can be used : DEV, EDEV, NFS, NFSD, SOCK, IP, EIP, ICMP, EICMP, TCP, ETCP, UDP, SOCK6, IP6, EIP6, ICMP6, EICMP6 & UDP6.
To generate all network statistic report use below command :
|
1 |
[root@localhost ~]# sar -n ALL |
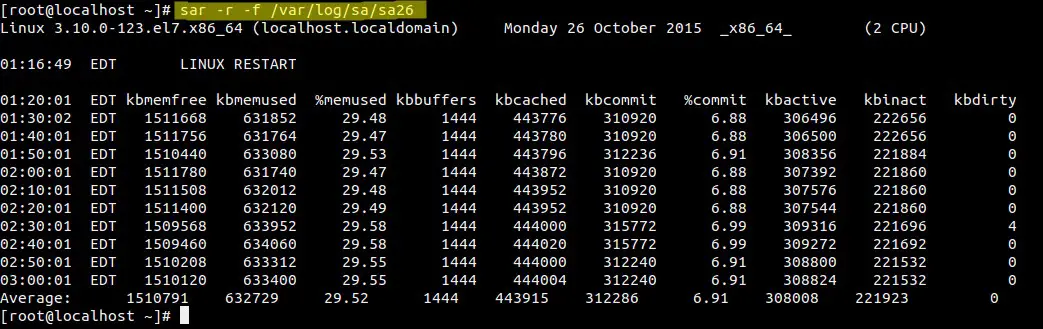
Example:7 Reading SAR log file using -f
As we have discuss that sar logs files are kept under /var/log/sa/saDD, using -f option in sar command we can read the log files.
|
1 |
[root@localhost ~]# sar -r -f /var/log/sa/sa26 |
See also 10 Practical Sar Usage Examples