vnStat is a console-based network traffic monitor for Linux and BSD that keeps a log of network traffic for the selected interface(s). It uses the network interface statistics provided by the kernel as information source. This means that vnStat won’t actually be sniffing any traffic and also ensures light use of system resources.
In this article we will show you how to install and use vnStat (Network Traffic Monitor) on RHEL/CentOS linux distribution.
vnstat features
- quick and simple to install and get running
- gathered statistics persists through system reboots
- can monitor multiple interfaces at the same time
- several output options
- summary, hourly, daily, monthly, weekly, top 10 days
- optional png image output (using libgd)
- months can be configured to follow billing period
- light, minimal resource usage
- same low cpu usage regardless of traffic
- can be used without root permissions
Install VnStat on RHEL/CentOS 6.x/7.x Linux
To start, you will need to enable the EPEL repositories for your version of Linux. To enable the EPEL repositories in CentOS/RHEL 6.x enter following command:
|
1 2 |
$wget https://dl.fedoraproject.org/pub/epel/epel-release-latest-6.noarch.rpm $rpm -ivh epel-release-latest-6.noarch |
To enable the EPEL repositories in CentOS/RHEL 7.x enter following command:
|
1 |
$ yum -y install epel-release |
Next, you can install VnStat as normal through yum.
|
1 |
$ yum -y install vnstat |
Once installed, the default configuration will work for most people. The default will run on the eth0 interface. If you need to change the interfaces, you will need to edit two files. It’s self explanatory. Change the occurrences of eth0 to eth1 (or your choice of interface).
|
1 2 |
nano /etc/sysconfig/vnstat nano /etc/vnstat.conf |
Next, we need to create the database where the data will be collected and stored. The command may generate an error. If it does, that’s fine. It is because the new file is created with ownership of the logged in user. We will fix this by running a chown on the file before starting the service.
|
1 2 |
$ vnstat -u -i eth0 $ chown vnstat:vnstat /var/lib/vnstat/eth0 |
That’s it. You’re ready to start the service and start collecting data.
|
1 2 |
$ service vnstat start $ chkconfig vnstat on |
How to use VnStat
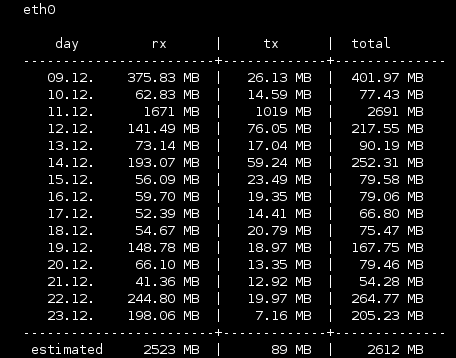
Using VnStat command line utility you can view statistics on bandwidth on per day, per month and per hour basis. It also provides option to show statistics in real-time.
You can see hourly, daily, weekly or montly statistics.
To get daily stats enter:
|
1 |
$ vnstat -d |

To get weekly stats enter:
|
1 |
$ vnstat -w |
To get monthly stats enter:
|
1 |
$ vnstat -m |
To get hourly stats enter:
|
1 |
$ vnstat -h |
To see traffic in real time enter:
|
1 |
$ vnstat -l |
![]()
Check man pages for more info on usage.


